For Windows Server 2022 and 2025 · IIS 10
Real-time IIS monitoring, down to every app pool
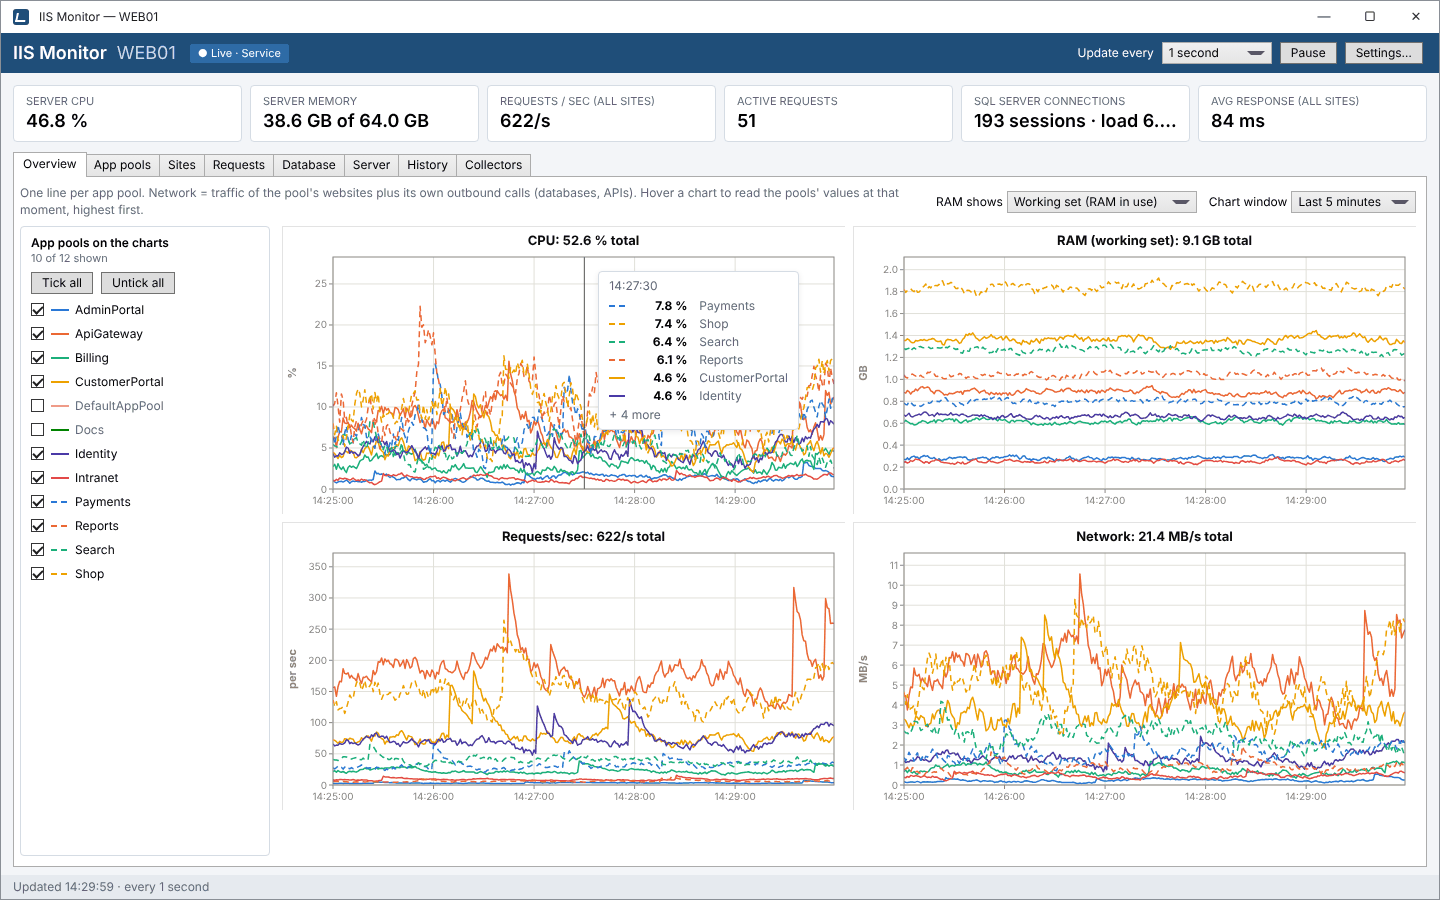
IIS Monitor watches every website and application pool on your server: CPU, memory, disk, network, response times, every request and the SQL Server load each pool creates. Live, as often as four times a second, and recorded for seven days.
Free and open source · Get the code on GitHub
 View full size
- Live updates, as often as
- 0.25 s
- History kept
- 7 days
- History resolution
- 10 s
- Installed on SQL Server
- Nothing
- Network ports opened
- None
Answers, not log files
The questions you ask when a server slows down
IIS Monitor puts each answer one tab away, so you can go from “the site is slow” to the app pool, the request or the query behind it.
- Which app pool is eating the CPU?Overview: every pool, one line each
- Which site got slow, and how slow?Sites: average, p95 and max response time
- Who is hammering /wp-login.php?Requests: every request and its IP
- Which queries is this app pool waiting on?Database: load, blocking, slow queries
- What happened at 3 a.m.?History: 7 days, recorded by a service
- Why is this column empty?Collectors: every source and its status
Features
One dashboard for the whole IIS server
Ten views, from a live comparison of every app pool to the single query that is blocking checkout.
-
Overview
CPU, RAM, requests/sec and network for all app pools, one line each, so the busy one stands out at a glance.
-
App pools
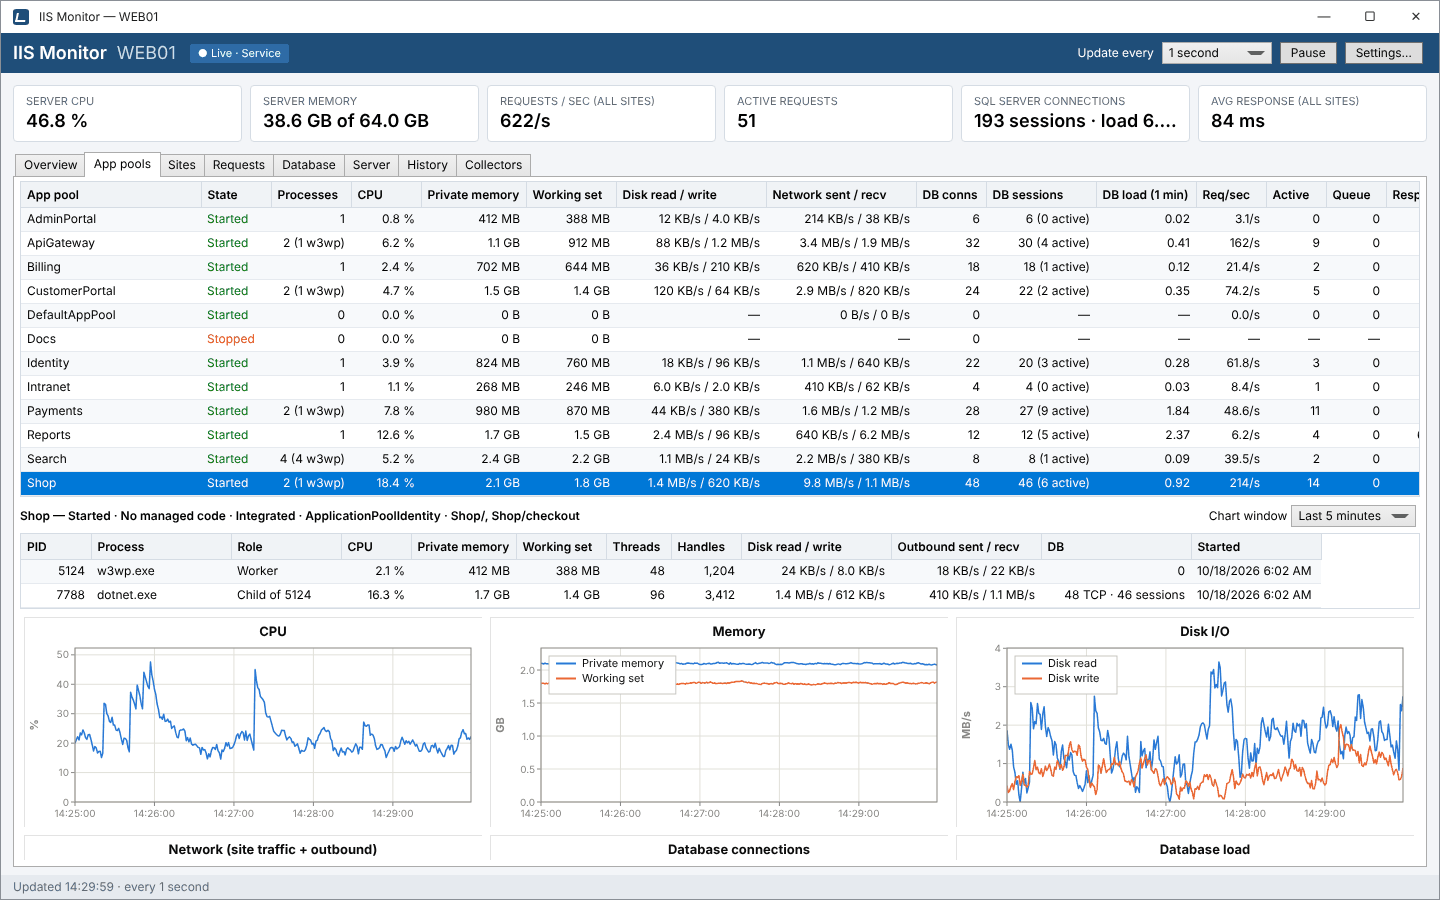
One row per pool with CPU, memory, disk, network, database and request metrics, its processes and twelve live charts.
-
Sites
Connections, requests/sec, bandwidth, response time (average, p95, max) and 4xx/5xx errors for each site.
-
Requests
A live log of every request with client IP, kind and timing, quick filters, and the IPs sending the most traffic.
-
Auto blacklist
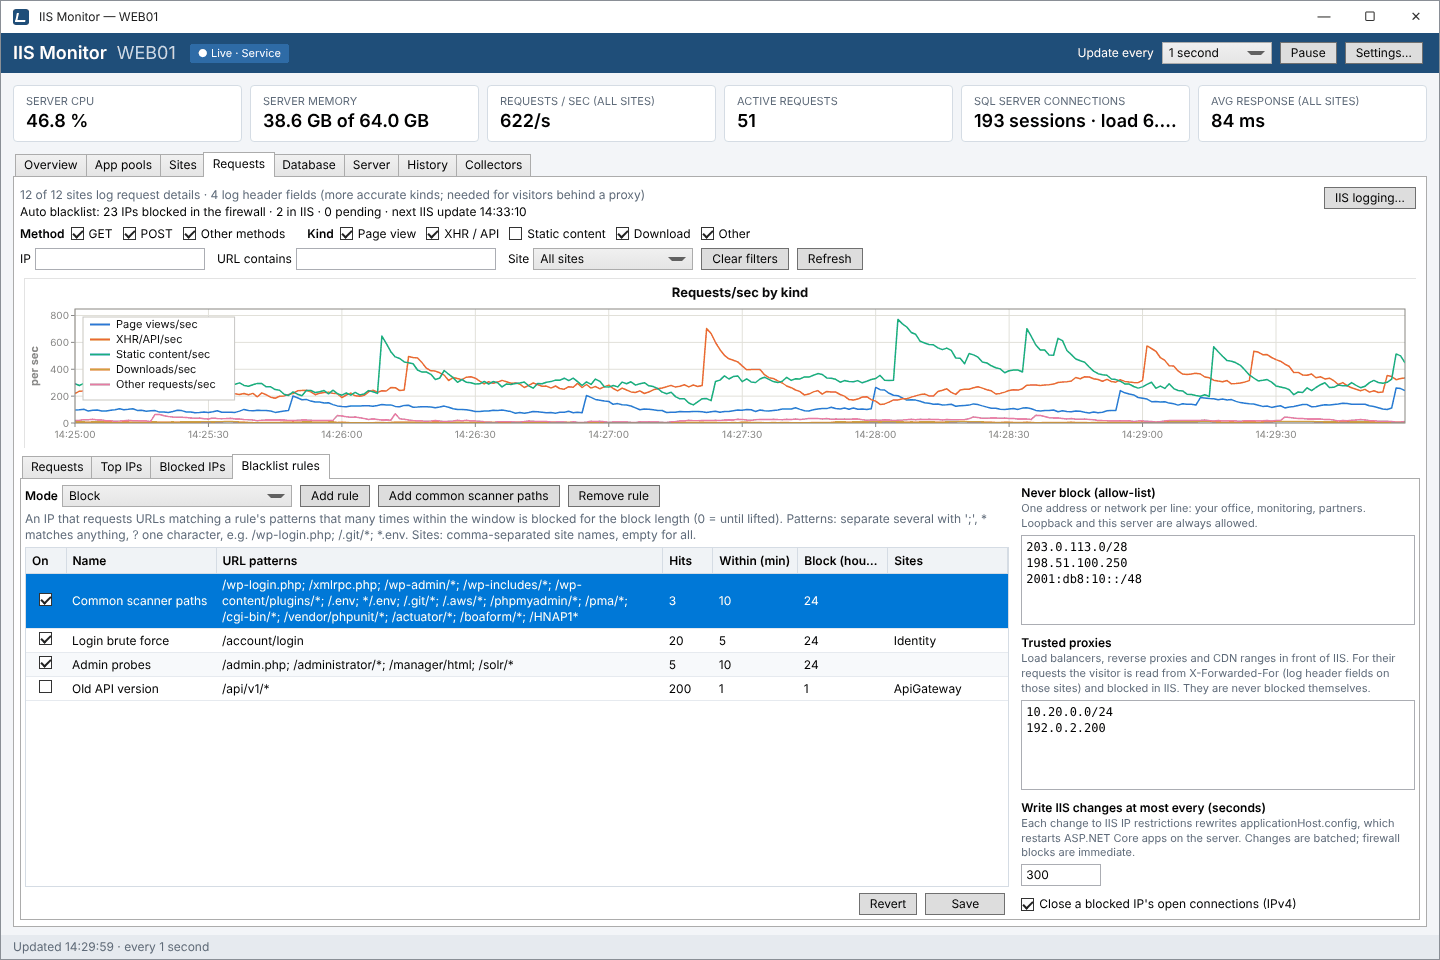
Rules that block IPs probing for /wp-login.php, /.env or your login page, in Windows Firewall or in IIS.
-
Database
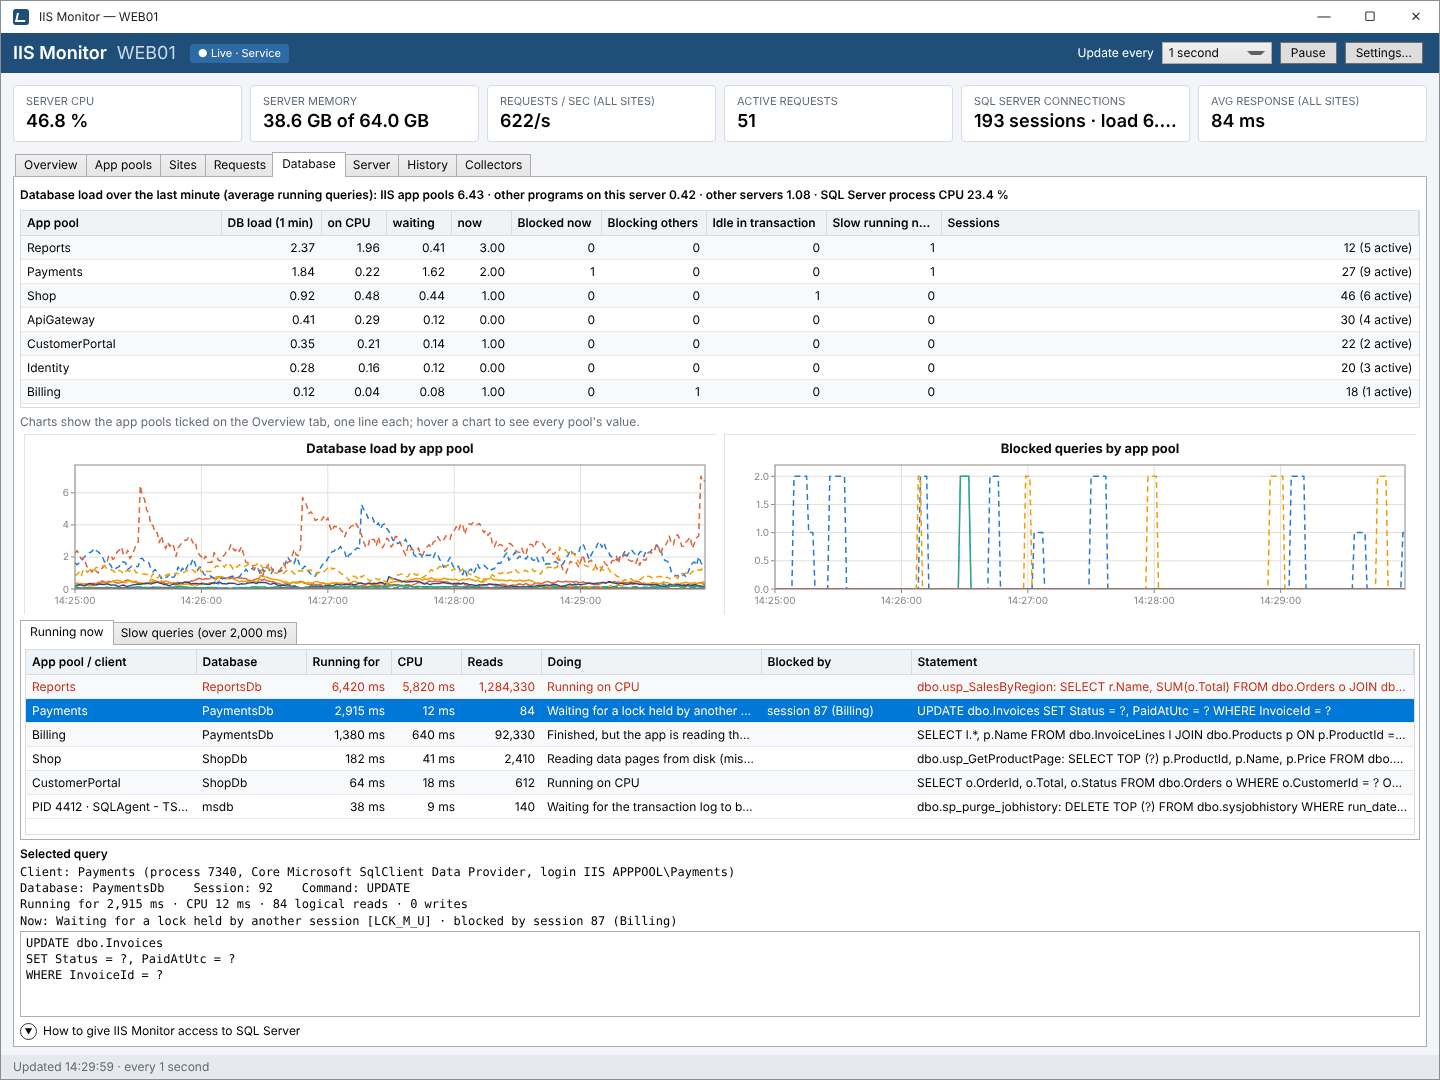
SQL Server load, blocking, the queries running now and slow queries, each traced to the app pool that sent it.
-
Server
Server CPU and memory next to SQL Server's own share, and the request mix by kind.
-
History
Every pool, site and the server recorded every 10 seconds and kept for 7 days, even when nobody is watching.
-
Collectors
Each data source and whether it is working, so an empty column or chart always comes with a reason.
-
Settings
Update interval, history resolution and retention, SQL Server connections and the tracing switches.
Built around app pools
Measured the way IIS really works
An app pool is more than one w3wp.exe, and website traffic never passes through it. IIS Monitor accounts for both, so the numbers add up.
- Every worker process and the processes it starts (out-of-process ASP.NET Core, PHP FastCGI, iisnode) count toward their pool.
- Website traffic comes from IIS, because HTTP.sys, not w3wp.exe, owns ports 80 and 443.
- Response times come straight from IIS's log stream (ETW), with no log files to parse.
- Recycles and web gardens just work: process IDs are re-mapped on every update.
 View full size
SQL Server, per app pool
Find the app pool behind a busy SQL Server
Every second, IIS Monitor asks SQL Server what is running and which process sent it, then adds it up per app pool. Nothing to install on the database server.
- Database load per app pool, split into time on CPU and time waiting.
- Blocking chains, with the app pool that holds the lock.
- Slow queries named after the procedure or batch your app called.
- Literal values replaced with
?before anything is stored.
 View full size
Auto blacklist
Stop scanners before they find something
Every request is logged with its client IP. Rules block an IP after it asks for URLs only attackers ask for, a few times within a few minutes.
- Windows Firewall blocks for direct visitors, IIS IP restrictions for visitors behind a proxy or CDN.
- A watch-only mode to try rules before they block anyone.
- Your allow-list, trusted proxies and the server itself are never blocked.
- Blocks expire on schedule, even while the service is stopped.
 View full size
How it works
Always collecting, nothing exposed
A small Windows service does the collecting; the dashboard just shows it. Everything stays on the server.
-
A service collects, day and night
The IIS Monitor service samples IIS, Windows and, if you like, SQL Server, whether or not anyone has the dashboard open.
-
History stays on the server
One averaged row per app pool, site and the server every 10 seconds, kept for 7 days in a local database only Administrators can read.
-
The dashboard shows it live
IIS Monitor connects to the service through a local, Administrators-only named pipe. Nothing listens on the network.
Open source
Free and open source on GitHub
IIS Monitor is free and open source under the MIT License. All of it is on GitHub: the Windows service, the dashboard and the install scripts. Clone it, build a self-contained package for your servers with one script, and follow every change.
- Use it on as many servers as you like, at work too, and change or share the code: MIT License.
- No build needed: download the ready-to-install package from the latest release.
- Or clone the code and build it yourself with the free .NET 10 SDK.
scripts\publish.cmdcreates a package that runs on any Windows Server 2022 or 2025, with no .NET to install there.- Report a problem or suggest a feature in GitHub Issues.
- Star or watch the repository to follow new changes.
git clone https://github.com/inanbd/IISMonitor.git
Open inanbd/IISMonitor
Up and running in a few minutes
Copy IIS Monitor to your server, run install-service.cmd as administrator and open it from the Start menu. No .NET runtime to install.