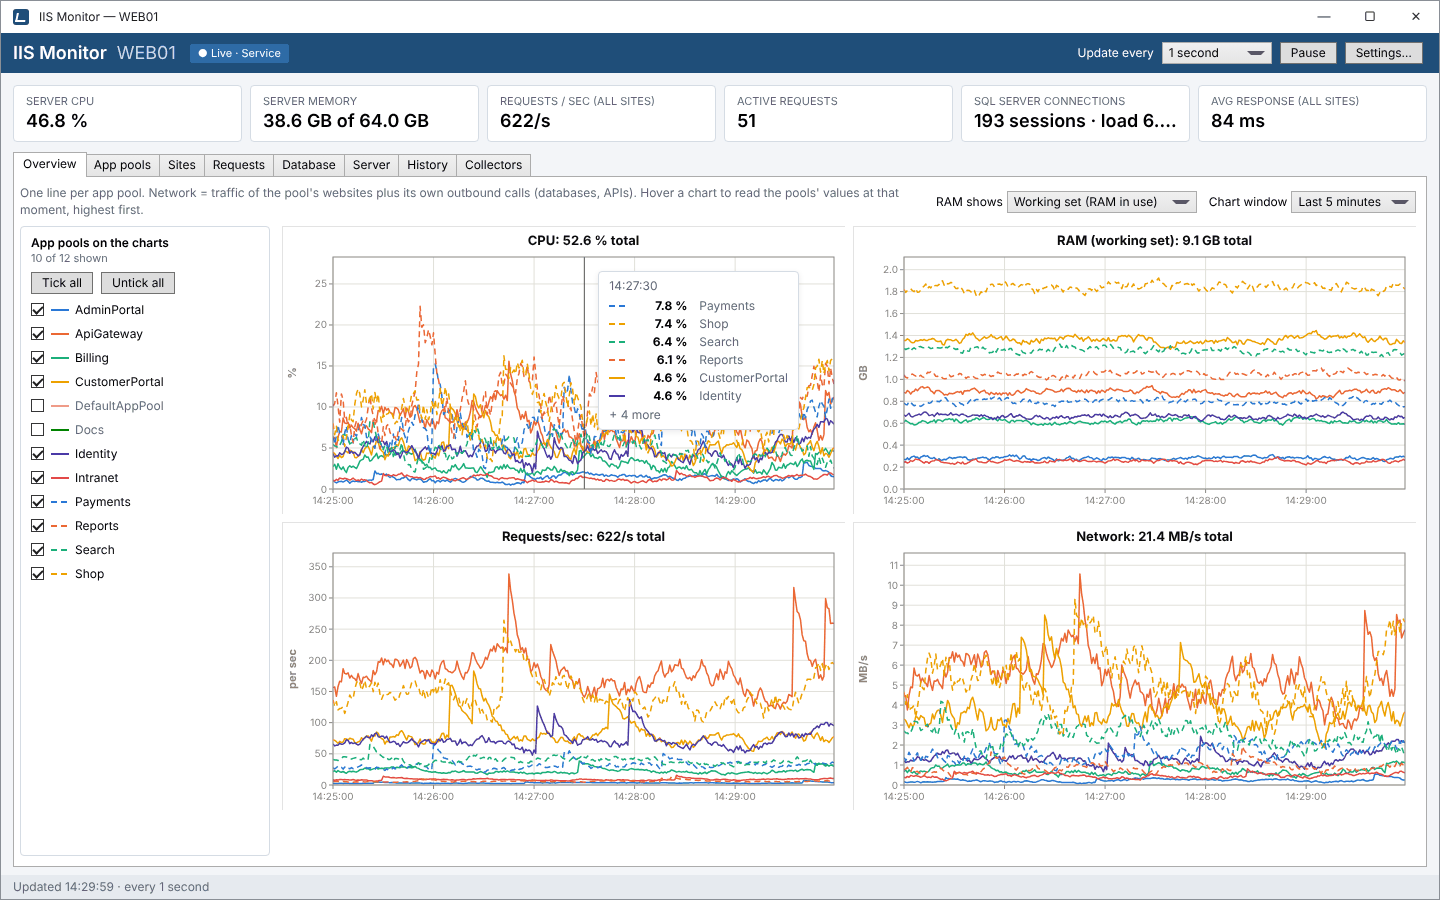
What the Overview tab shows
The Overview tab is the first thing you see when IIS Monitor opens. It puts every application pool on the same four charts, one line per pool, so the pool that suddenly uses more CPU, memory, requests or bandwidth than the others stands out at a glance.
- CPU
- Each pool's share of the whole machine, across all cores, just like the Processes tab in Task Manager. A pool's CPU includes every
w3wp.exeit runs (several for a web garden) and every process those start, such as an out-of-process ASP.NET Core app, PHP FastCGI or iisnode. - RAM
- Either the working set, the physical memory the pool is using right now, or private bytes, the committed memory that IIS's private-memory recycling limit watches. Switch between them with RAM shows.
- Requests/sec
- Requests per second handled by the pool, from IIS's own
W3SVC_W3WPperformance counters. - Network
- The traffic of the pool's websites plus the outbound traffic its processes create themselves, such as calls to SQL Server or external APIs. See how network is counted below.
Each chart's title shows the current total of the pools you have ticked, for example CPU: 52.6 % total or Network: 21.4 MB/s total, so you can see the overall load and each pool's part of it on one screen.
Choose which pools to compare
The list on the left, App pools on the charts, doubles as the legend: each name sits next to its line color and style.
- Tick or untick a pool to add it to or remove it from all four charts. The summary under the heading shows how many are shown, such as “10 of 12 shown”.
- Tick all and Untick all change every pool at once. Untick everything, then tick the two or three pools you want to compare side by side.
- Every pool starts ticked, including pools you create later, so a new application never goes unnoticed.
- The first eight pools get eight distinct colors, chosen to stay apart for color-blind readers. From the ninth pool on, the colors repeat with dashed lines, then dotted lines.
Your ticks, the colors assigned to each pool and the RAM choice are remembered per Windows user, in %LocalAppData%\IISMonitor\dashboard.json, so the Overview looks the same the next time you open it. The pools ticked here also decide which lines appear on the Database tab's charts.
Read exact values at any moment
Move the mouse over any chart. A crosshair snaps to the nearest sample and a read-out lists every ticked pool's value at that moment, highest first, with the time at the top. That makes it easy to answer “which pool caused that spike?” without guessing between similar colors.
Right-click a chart to copy it or save it as an image, for a ticket or a post-mortem.
Set the time window and update speed
- Chart window sets how much of the recent past the charts show: the last 2, 5, 15 or 30 minutes, or the last hour.
- Update every in the toolbar sets how often data is collected and the screen refreshes, from 0.25 seconds to 1 minute. It is a setting of the collector service, so it also sets the resolution of every live chart.
- Pause freezes the screen while you read it; data keeps being collected in the background. Resume jumps back to live.
How network traffic is counted
Incoming website traffic never passes through w3wp.exe. The kernel driver HTTP.sys owns ports 80 and 443, so Windows charges that traffic to the System process. IIS Monitor therefore builds a pool's network total from two sources:
- Website traffic from IIS's
Web Serviceperformance counters, credited to the pool that runs each site's root application. - Outbound traffic that the pool's own processes create (database calls, API calls), from the kernel's TCP and UDP trace events.
Loopback traffic between a pool's own processes, for example w3wp.exe relaying requests to an out-of-process ASP.NET Core app, is not counted twice.
How to use it: find the pool behind a slowdown
- Open IIS Monitor from the Start menu. The Overview tab is already selected.
- Look at the chart titles for the totals, then for the line that stands out. If too many lines overlap, click Untick all and tick only the busiest few.
- Hover the spike to read each pool's value at that moment.
- Switch to App pools and select that pool to see its processes, queue, response times and database activity.
- If the problem happened earlier, open History to look at the same pool over hours or days.
Tip: give each site its own app pool. CPU, memory, disk and database numbers belong to a pool, not a site, because IIS runs each pool in its own processes. When several sites share a pool, those numbers can't be split between them.