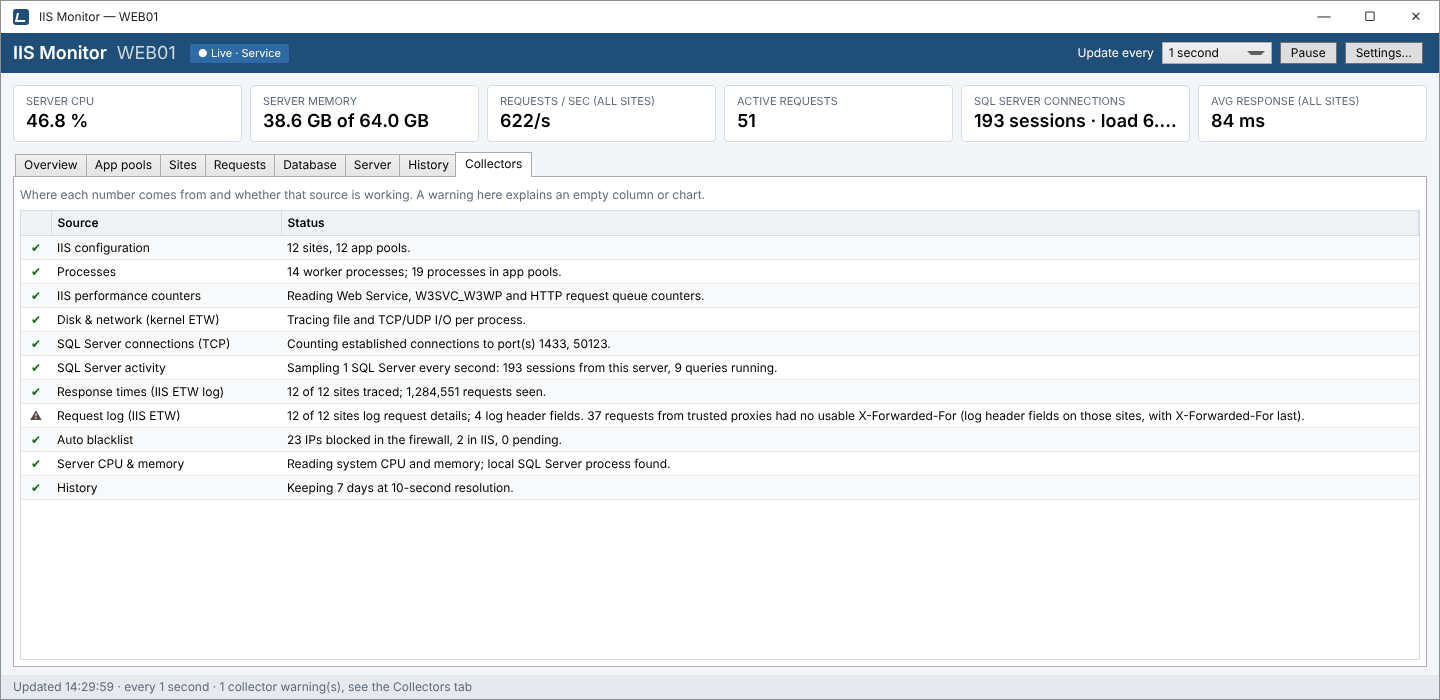
An empty column always has a reason
IIS Monitor combines a dozen data sources, and a few of them depend on how the server is set up: whether IIS sends its log to ETW, whether a kernel trace session is free, whether SQL Server lets IIS Monitor in. Rather than leave you guessing at a dash, the Collectors tab lists every source with a green check mark or a red warning and a plain-language status. When any source has a warning, the status bar says so on every tab.
The sources and what to do about a warning
| Source | What it provides | If it shows a warning |
|---|---|---|
| Permissions | Shown only when IIS Monitor isn't running as administrator. | Run the dashboard as administrator (the Start menu shortcut asks for it), or install the service. |
| IIS configuration | Sites, app pools, applications and bindings: “12 sites, 12 app pools.” | Check that IIS is installed and that the account can read applicationHost.config. |
| Processes | Each pool's worker processes and their children, with CPU, memory, threads and handles. | Some processes couldn't be read (access denied or exited); usually a missing administrator right. |
| IIS performance counters | Web Service, W3SVC_W3WP and HTTP request queue counters: requests, connections, bandwidth, active requests, queue. |
Rebuild the counters with lodctr /R from an elevated prompt, then restart the service. |
| Disk & network (kernel ETW) | File and TCP/UDP bytes per process, the data Resource Monitor uses. | Windows allows up to 8 such system trace sessions at once, and other monitoring tools may be using them. Meanwhile disk falls back to process I/O counters and pool network shows website traffic only. |
| SQL Server connections (TCP) | Open connections from pool processes to SQL Server ports. | Add the port your SQL Server listens on in Settings. |
| SQL Server activity | Sessions, database load, blocking and slow queries per pool. | “Not set up” until you add a connection string. Otherwise, check that SQL Server can be reached and that the login has VIEW SERVER STATE (how). |
| Response times (IIS ETW log) | Response time and errors per site and pool: “12 of 12 sites traced; 1,284,551 requests seen.” | Click Enable response times and make sure the HTTP Logging role service is installed (details). |
| Request log (IIS ETW) | Client IP, method, kind and user agent for the Requests tab and the auto blacklist. | Use Set up IIS logging… on the Requests tab. A warning also appears when ETW drops events or when trusted proxies send requests without a usable X-Forwarded-For. |
| Auto blacklist | Rule mode and how many IPs are blocked in the firewall and in IIS. | Read the message: the firewall may be off for the active profile, Group Policy may ignore local rules, or the IIS IP and Domain Restrictions role service may be missing. |
| Server CPU & memory | Whole-machine CPU and memory, and the local SQL Server process. | Rare; the message gives the Windows error. |
| History | How much history is kept and at what resolution: “Keeping 7 days at 10-second resolution.” | The history database couldn't be written; check free disk space and the Application event log. |
How to use it
- When the status bar mentions a collector warning, or a column shows a dash, open the Collectors tab.
- Find the source with the red warning and read its message: it names the cause.
- Fix it as above, then watch the row turn green.
Service errors are also written to the Windows Application event log, source IISMonitor. For more symptoms and fixes, see Troubleshooting.