Features
Everything IIS Monitor shows you
IIS Monitor is one window with eight tabs and a settings dialog. Each page below explains one of them in detail: what every column and chart means, where the numbers come from and how to use them.
-
Overview
CPU, RAM, requests/sec and network for all app pools, one line each, so the busy one stands out at a glance.
-
App pools
One row per pool with CPU, memory, disk, network, database and request metrics, its processes and twelve live charts.
-
Sites
Connections, requests/sec, bandwidth, response time (average, p95, max) and 4xx/5xx errors for each site.
-
Requests
A live log of every request with client IP, kind and timing, quick filters, and the IPs sending the most traffic.
-
Auto blacklist
Rules that block IPs probing for /wp-login.php, /.env or your login page, in Windows Firewall or in IIS.
-
Database
SQL Server load, blocking, the queries running now and slow queries, each traced to the app pool that sent it.
-
Server
Server CPU and memory next to SQL Server's own share, and the request mix by kind.
-
History
Every pool, site and the server recorded every 10 seconds and kept for 7 days, even when nobody is watching.
-
Collectors
Each data source and whether it is working, so an empty column or chart always comes with a reason.
-
Settings
Update interval, history resolution and retention, SQL Server connections and the tracing switches.
The main window
Always visible: the toolbar, the tiles and the status bar
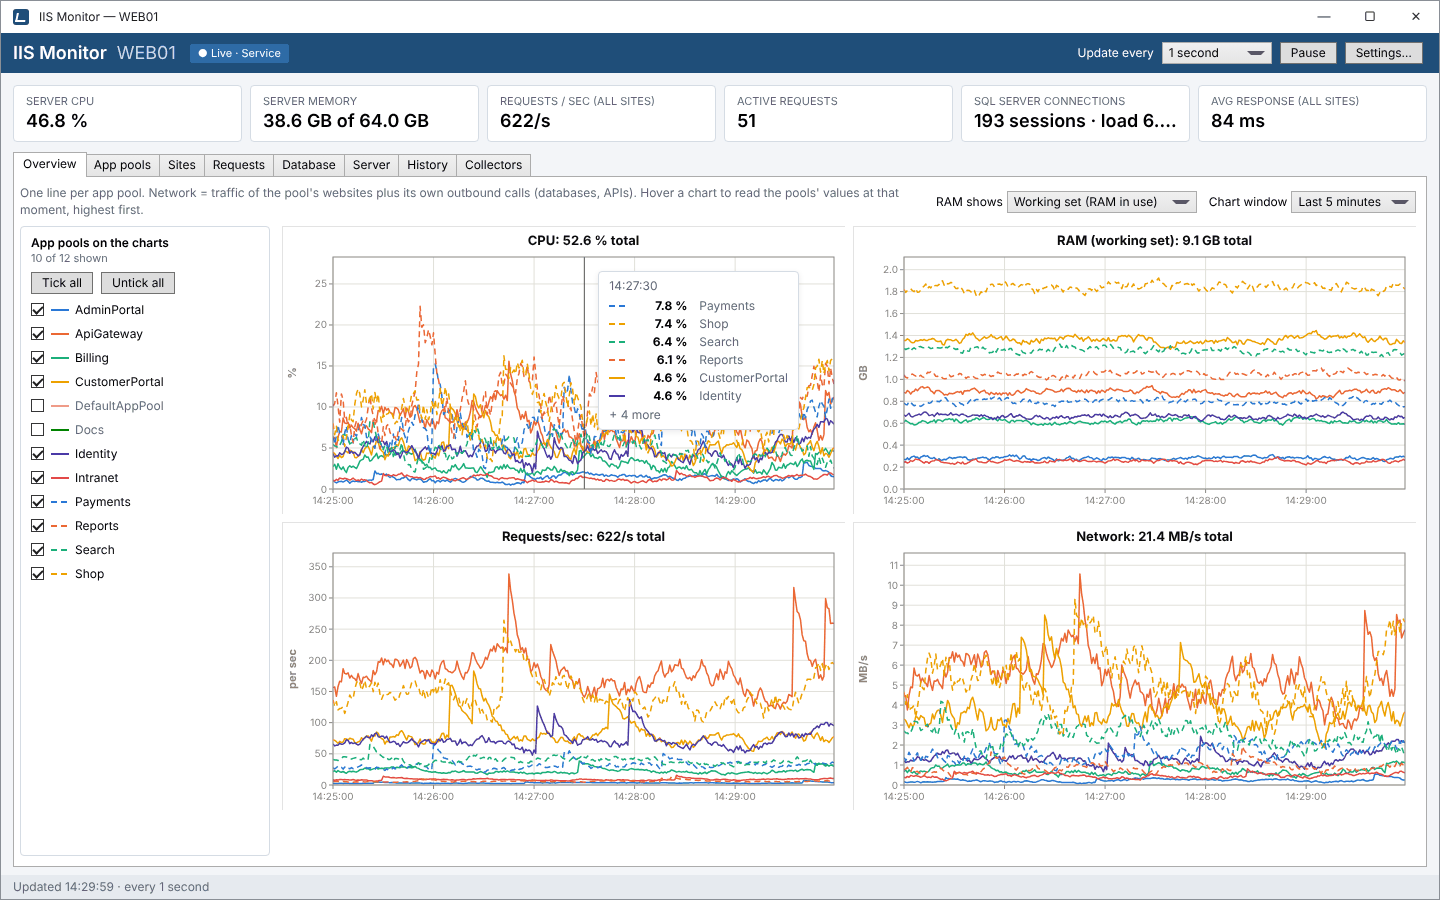
Whatever tab you are on, the top of the window shows the server's vital signs and the bottom tells you how fresh they are.
- Toolbar: the server name, whether data comes from the service or standalone mode, Update every, Pause, Enable response times and Settings….
- Tiles: server CPU, server memory, requests per second and active requests across all sites, SQL Server connections or sessions with the database load, and the average response time.
- Status bar: the time of the last update, the update interval and how many collectors have a warning.
 View full size
Live, history or setup: which tab to open
| You want to… | Open |
|---|---|
| See which app pool is busy right now | Overview |
| Drill into one pool's processes, memory or queue | App pools |
| Check a site's response times and errors | Sites |
| See who is sending requests, and what kind | Requests |
| Block an IP, or let rules do it | Requests › Blocked IPs and Blacklist rules |
| Find the queries slowing an app down | Database |
| Watch the machine and the local SQL Server | Server |
| Look back at last night or last week | History |
| Understand why a number is missing | Collectors |
| Change intervals, retention or SQL Server access | Settings |