Always recording, even with the dashboard closed
The IIS Monitor Windows service collects data around the clock and writes one row per app pool, per site and for the server every 10 seconds. Each row holds the averages of the live samples in that step, plus the maximums for CPU, connections and response time, so a short spike isn't averaged away. Seven days are kept, and older rows are deleted every hour.
Because a service does the recording, history has no gaps when nobody is logged on or the dashboard is closed. (Without the service, the dashboard records history only while it is open.)
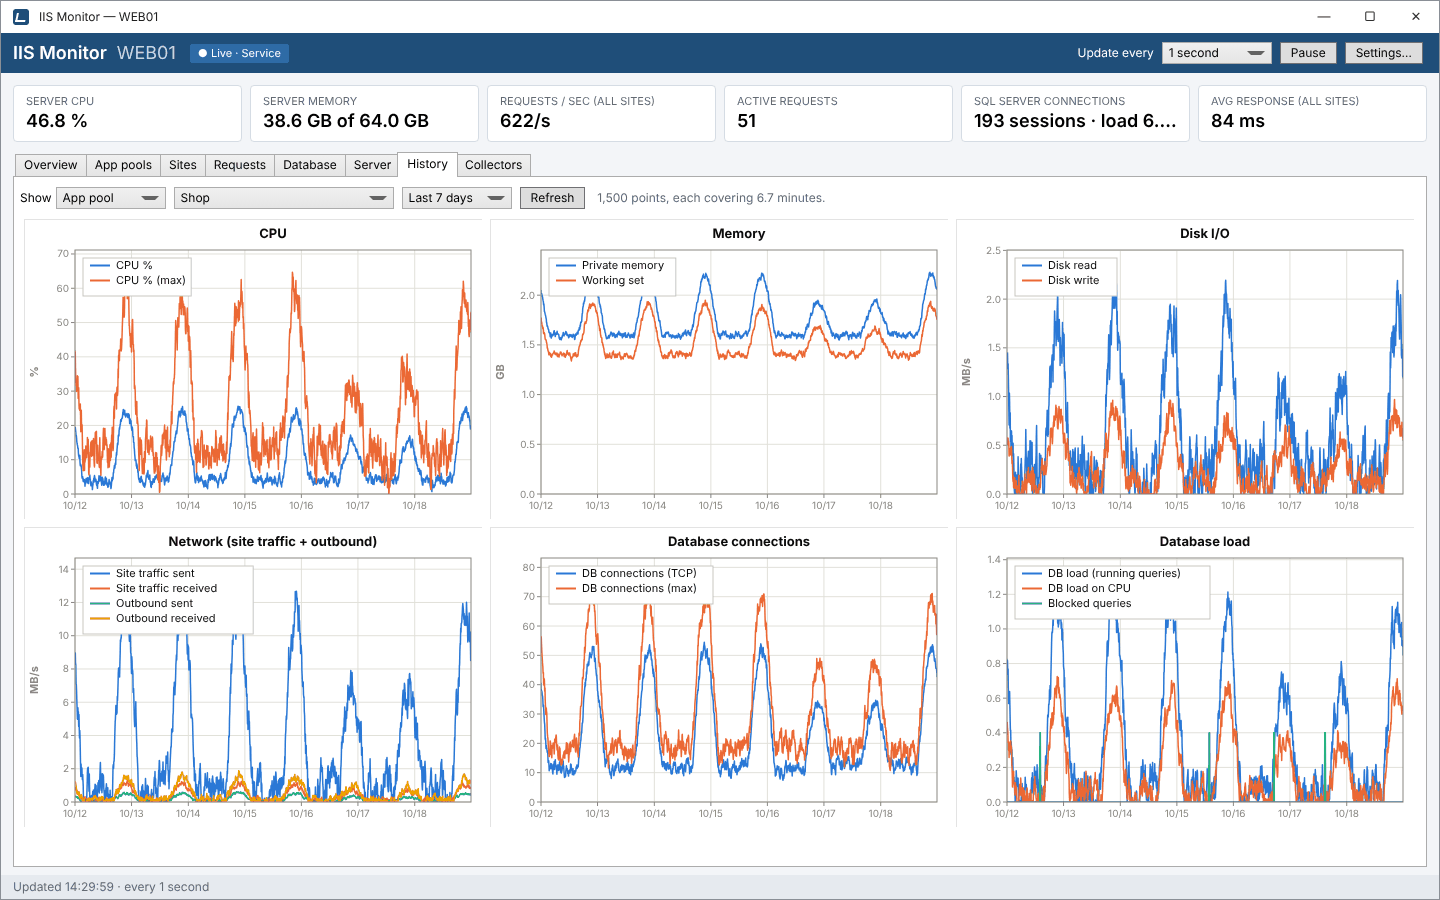
Browse the history
- Open the History tab.
- Choose what to show: App pool, Site or Server.
- Pick the pool or site from the second list.
- Choose a range: the last hour, 6 hours, 24 hours, 3 days or 7 days. The charts load straight away; Refresh brings them up to date.
Each kind shows the same charts as its live tab: the twelve app pool charts, the five site charts or the three server charts.
Zoom in on a moment
History charts can be panned and zoomed by dragging, so you can open a whole week and then close in on the ten minutes around an incident. Hovering shows the date and time with every line's value; right-clicking copies or saves the chart as an image.
How long ranges are drawn
A chart shows up to 1,500 points. Longer ranges merge rows into wider points: the last 7 days becomes points of about 6.7 minutes, and the status line says so, for example 1,500 points, each covering 6.7 minutes. When rows are merged, averages stay averages, while maximums and p95 response times show the worst value inside each point, so peaks remain visible however far you zoom out.
What is kept
| For | Metrics |
|---|---|
| Each app pool | CPU (average and maximum), private memory, working set, processes, threads, handles, disk read and write, site traffic and outbound traffic, SQL Server connections (average and maximum), sessions and active sessions, database load and its CPU part, blocked and blocking queries, slow queries finished, requests/sec, active requests, queue length, response time (average, p95, maximum), 4xx and 5xx per second. |
| Each site | Requests/sec, connections (average and maximum), bytes sent and received, response time (average, p95, maximum), 4xx and 5xx per second. |
| The server | CPU (average and maximum), memory used and total, SQL Server CPU and memory, and requests/sec by kind. |
| Slow queries | Every query over the slow threshold, with literal values removed (see Database). |
| Blocks | IP blocks and their history (see Auto blacklist). |
Storage and retention
History lives in a SQLite database on the server, %ProgramData%\IISMonitor\history.db, in a folder only Administrators and SYSTEM can open.
- At the default 10-second resolution, each app pool or site takes about 60,000 rows per week.
- Measured: 10 app pools and 10 sites with every metric populated take about 260 MB for 7 days, and a 7-day chart loads in about 0.15 seconds.
- A 30-second resolution cuts the size to a third.
Change the resolution (5 seconds to 5 minutes) and the number of days to keep in Settings.
How to use it: what happened last night?
- Choose Server and Last 24 hours to find when CPU, memory or the request mix changed.
- Switch to App pool and step through the pools to see which one moved at that time.
- Drag to zoom into the incident and read the exact values: CPU maximum, queue length, p95 response time, database load.
- If database load rose, open the slow queries for that range to see what ran.