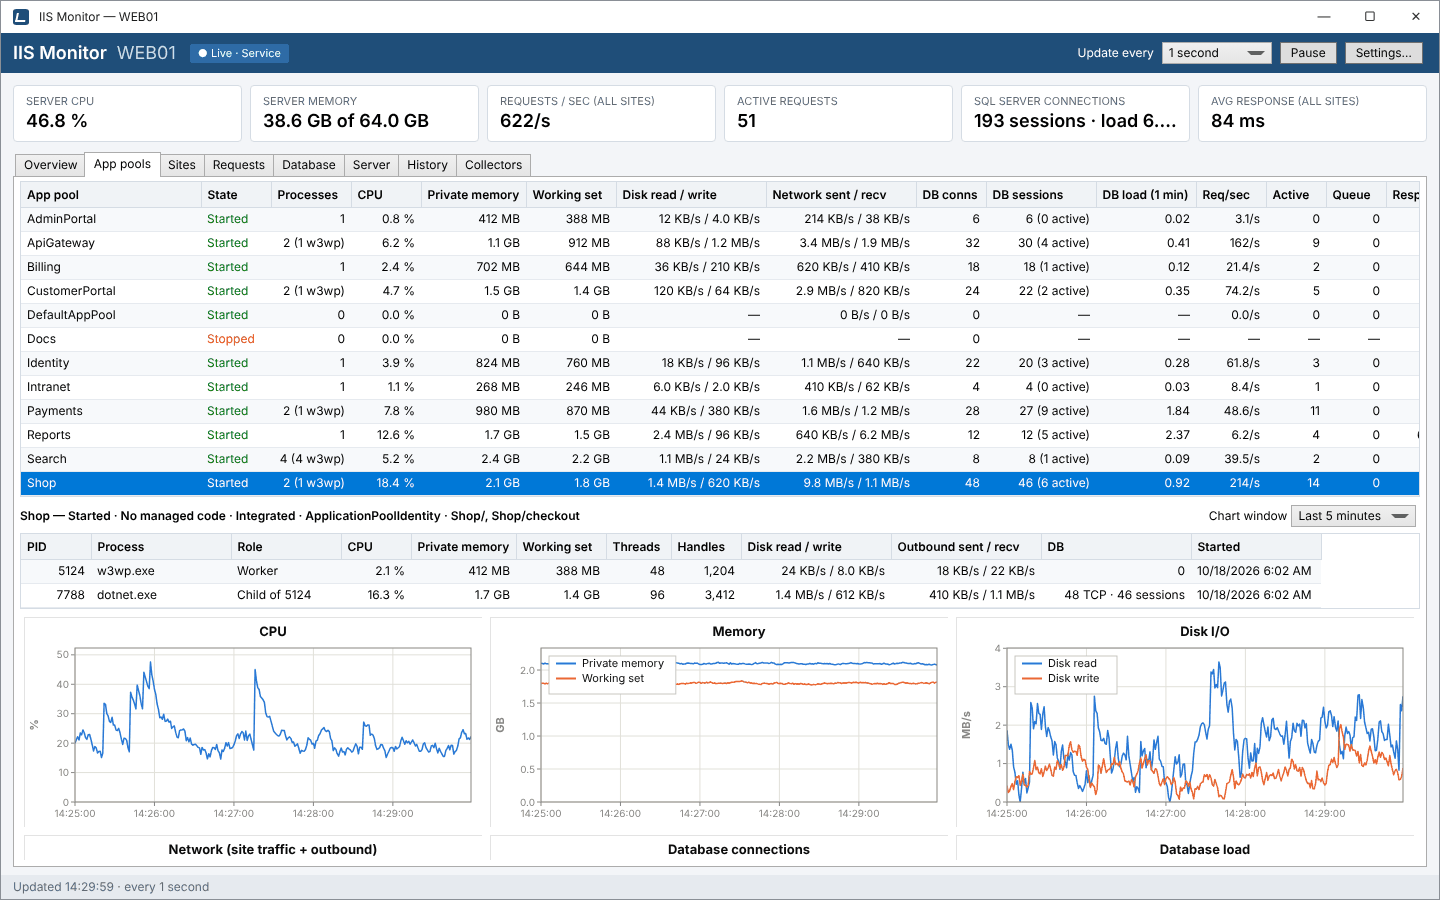
One row per application pool
The App pools tab lists every application pool on the server with everything it is using right now. Click a column header to sort by it, for example by CPU to put the busiest pool on top. Columns can be resized and dragged into a different order.
- State
- Started in green, anything else (such as Stopped) in red.
- Processes
- How many processes belong to the pool: its
w3wp.exeworker processes plus every process they started. “2 (1 w3wp)” means one worker process and one child, such asdotnet.exefor an out-of-process ASP.NET Core app. An idle pool that has no worker process yet shows 0, not an error. - CPU
- Share of the whole machine (all cores), like Task Manager.
- Private memory
- Committed memory of all the pool's processes: the number IIS's private-memory recycling limit watches.
- Working set
- Physical RAM the pool's processes are using now.
- Disk read / write
- Bytes per second read from and written to disk, from the kernel's file I/O trace (the data Resource Monitor uses). If that trace is off, Windows' per-process I/O counters are used instead.
- Network sent / recv
- Website traffic of the pool's sites plus the pool's own outbound traffic. See how network is counted.
- DB conns
- Open TCP connections from the pool's processes to SQL Server ports: 1433, any port a local SQL Server listens on, and ports you add in Settings.
- DB sessions
- Sessions SQL Server itself reports for the pool's processes, with how many are active. Needs a SQL Server connection string; see Database.
- DB load (1 min)
- Average number of the pool's queries running in SQL Server at once over the last minute. 1.00 means one query busy all the time.
- Req/sec, Active
- Requests per second and requests being processed right now, from IIS's
W3SVC_W3WPcounters. - Queue
- Requests waiting in the pool's HTTP.sys request queue. Anything above zero for long means the pool can't keep up.
- Resp. avg, Resp. p95
- Average and 95th-percentile response time of the requests the pool's sites finished during the last update, from IIS's log stream. “idle” means no request finished in that interval.
A dash (—) means the value isn't available. The Collectors tab always says why, for example when kernel tracing is off or no SQL Server connection string is set.
The selected pool and its processes
Select a pool to see its details below the grid. The header line names the pool with its state, .NET CLR version (or “No managed code”), pipeline mode, identity and the applications it serves, for example:
Shop — Started · No managed code · Integrated · ApplicationPoolIdentity · Shop/, Shop/checkoutUnder it, a small grid lists every process in the pool:
- PID, Process
- Process ID and executable name. IDs change every time the pool recycles; IIS Monitor re-maps them on every update.
- Role
- Worker for a
w3wp.exe, or Child of 5124 for a process started by one. - CPU, memory
- CPU share, private memory and working set of that process alone.
- Threads, Handles
- Climbing numbers here often point to a thread or handle leak.
- Disk, Outbound
- The process's disk I/O and the network traffic it creates itself (website traffic belongs to HTTP.sys, so per-process network is outbound only).
- DB
- Its SQL Server TCP connections and, when configured, its sessions: “48 TCP · 46 sessions”.
- Started
- When the process started: a recent time tells you the pool just recycled.
Twelve live charts for the selected pool
Below the processes, live charts cover the last 2 minutes to 1 hour (Chart window). Hover any chart to read exact values.
| Chart | Lines |
|---|---|
| CPU | CPU % |
| Memory | Private memory, working set |
| Disk I/O | Disk read, disk write |
| Network | Site traffic sent and received, outbound sent and received |
| Database connections | TCP connections, SQL Server sessions, active sessions |
| Database load | Running queries, of which on CPU, blocked queries, queries it blocks |
| Slow queries finished | Queries over the slow threshold that finished |
| Requests/sec | Requests per second |
| Response time | Average, p95, maximum |
| Active requests & queue | Active requests, queue length |
| Errors/sec | 4xx and 5xx responses per second |
| Processes | Number of processes in the pool |
How to use it
Find a memory leak before IIS recycles the pool
- Sort the grid by Private memory and select the largest pool.
- Set Chart window to Last hour and watch the Memory chart. A line that only climbs, never falling back after garbage collection, is worth investigating.
- Check the processes grid: if the memory sits in a child process (
dotnet.exe,php-cgi.exe,node.exe), that is the app to profile. - Open History for the pool over 24 hours or 7 days to see whether memory resets at each recycle.
Tell a slow app from a slow database
- Select the pool and compare its Response time chart with its Database load chart.
- If response times rise together with database load, and most of the load is waiting rather than on CPU, the time is going into SQL Server: open the Database tab to see which queries.
- If response times rise while CPU is high and database load is flat, the time is being spent in the app itself.
- A growing Queue with few Active requests points to a pool that is starved of worker threads or stuck.
Why not per site? CPU, memory, disk and database connections belong to an app pool: IIS runs each pool in its own processes, and when several sites share one, there is no way to split those numbers between them. Requests, bandwidth and response times are still per site, on the Sites tab.