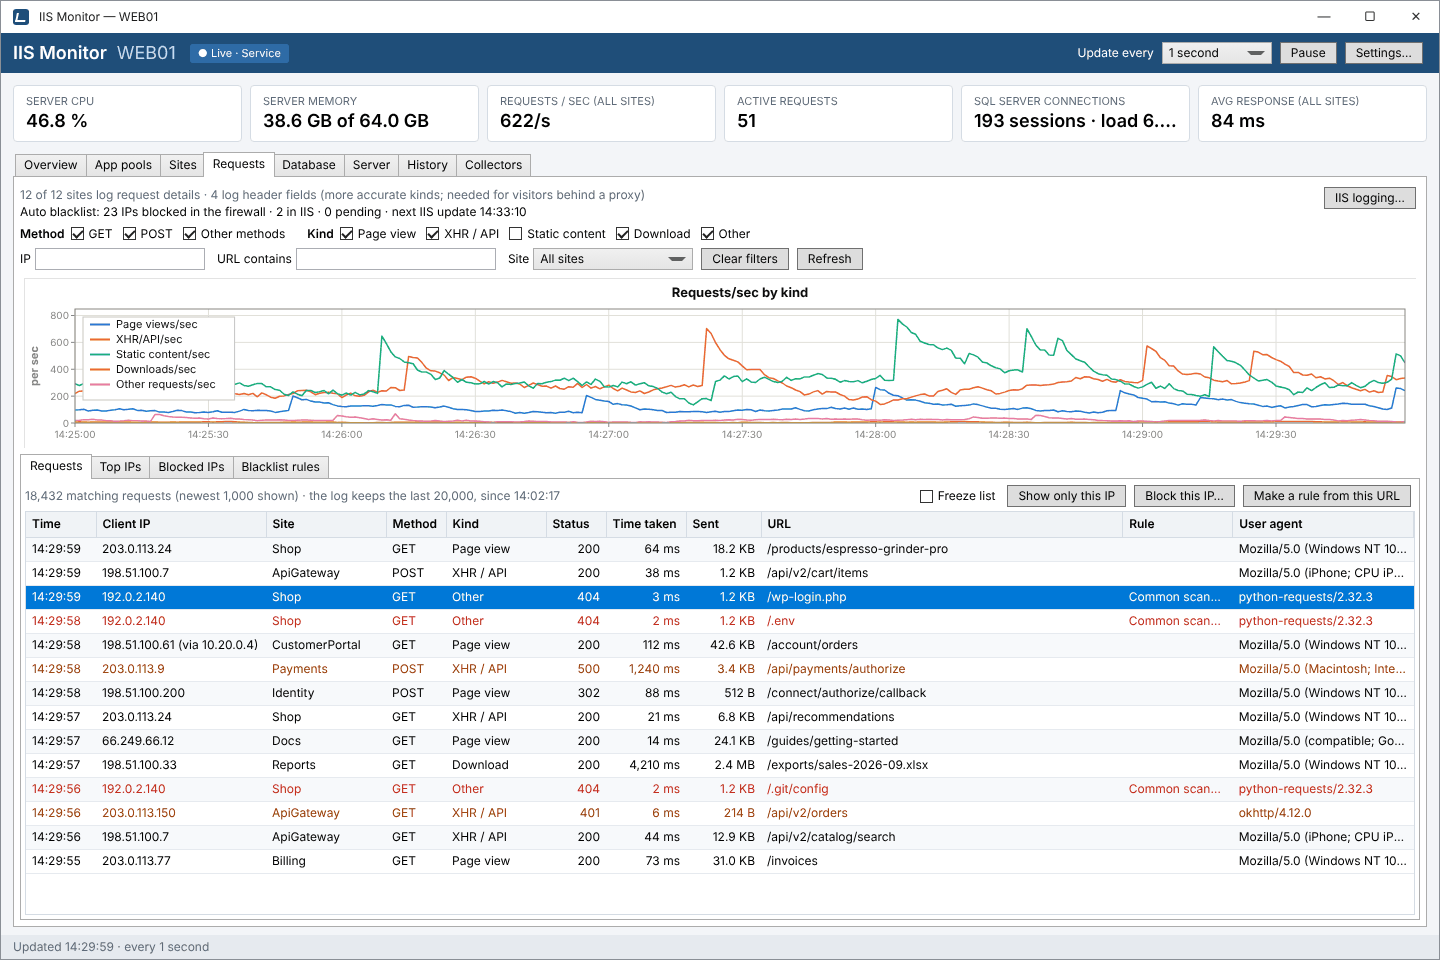
A live log of every request
The Requests tab lists every request IIS finishes, from any IP, as it happens: when it came in, who sent it, which site it hit, what kind of request it was, how IIS answered and how long that took. Above the list, a chart shows requests per second by kind, and next to it are the Top IPs, the blocked IPs and the blacklist rules.
Set up IIS logging (once)
The request log reads the same ETW stream as live response times, with a few more fields. Click Set up IIS logging… on the tab (the button appears while some sites aren't set up; IIS logging… is always there). IIS Monitor shows each site's current state and asks before it changes applicationHost.config.
 View full size
- Request details, all sites
- Sends log entries to ETW (log files are still written) with the client IP, method, bytes sent, user agent and substatus fields. These are standard W3C fields, most of them on by default, and they cost almost nothing. They are needed for everything on this tab and for the auto blacklist.
- Header fields, per site
- Optional. Logs the request headers
X-Requested-With,Sec-Fetch-DestandSec-Fetch-Modeand the response'sContent-TypeandContent-Disposition, for accurate request kinds, plusX-Forwarded-For, to see and block visitors behind a reverse proxy, load balancer or CDN.
Header fields are IIS custom log fields. On a site that logs them, IIS turns off kernel-mode caching, which costs some CPU on sites serving a lot of static files, and log file names get an _x suffix. Turn them on only where you need them: sites behind a proxy, or sites where you want exact page / API / download counts.
IIS Monitor keeps its X-Forwarded-For field last on purpose. If another custom field is added after it later, the tab says so and Set up IIS logging… puts it back. Sites created later need setting up again.
Status lines
Two lines at the top keep you informed: how many sites log request details and header fields (and whether ETW dropped events under extreme load, or proxied requests arrived without a usable X-Forwarded-For), and what the auto blacklist is doing, for example 23 IPs blocked in the firewall · 2 in IIS · 0 pending · next IIS update 14:33:10.
Filter by method, kind, IP, URL and site
Filters apply to the request list and to the “Matching” column of Top IPs.
- Method
- Tick GET, POST and Other methods (PUT, DELETE, HEAD, OPTIONS…).
- Kind
- Tick the kinds of request to show; untick Static content, for instance, to hide CSS, scripts and images.
- IP
- An address (
203.0.113.5), a network (203.0.113.0/24) or the start of one (203.0.). Empty for any IP. - URL contains
- Any part of the path, such as
/api/orlogin. - Site
- One site, or all sites.
Clear filters resets them all; Refresh reloads the list now.
How each request's kind is decided
| Kind | What counts |
|---|---|
| Page view | A page a browser navigated to. |
| XHR / API | fetch() and XMLHttpRequest calls, JSON and other API responses, /api/ paths, WebSockets and SignalR. Page changes made by script (Turbo, htmx, Blazor enhanced navigation) count here too. |
| Static content | CSS, JavaScript, images, fonts, audio and video. |
| Download | Files the browser saves: Content-Disposition: attachment, PDF, ZIP, Office documents, installers… |
| Other | robots.txt, CORS preflights, scanner probes and anything else. |
When a site logs header fields, kinds come from the browser's Sec-Fetch-* headers and the response's content type (browsers send Sec-Fetch-* to HTTPS sites only). Otherwise they are worked out from the method, status and URL: the extension, /api/ and similar.
Requests per second by kind
The chart shows page views, XHR/API calls, static content, downloads and other requests per second across all sites. The same chart is on the Server tab, and the server's history keeps it, so you can see how the mix changes over a day or a week. A sudden wall of Other is usually a scanner.
The request list
The list shows the newest requests that match the filters. The Windows service keeps the last 20,000 requests in memory; the line above the list says how many match and since when the log goes back.
- Time, Client IP
- When the request finished and who sent it. A visitor behind a trusted proxy is shown with the proxy:
198.51.100.61 (via 10.20.0.4). - Site, Method, Kind
- Which site, which HTTP method and which kind of request.
- Status
- The HTTP status with its IIS substatus, such as
404or403.503. - Time taken, Sent
- How long IIS took and how many bytes it sent back.
- URL
- The path. Query strings are never logged.
- Rule, User agent
- The blacklist rule the URL matches, if any, and the client's user agent.
Error responses are shown in orange, and requests to a blacklist rule's URLs in red, so probes stand out. Rows can be sorted by any column.
Select a row to act on it:
- Freeze list stops the list from moving while you read it.
- Show only this IP puts the request's IP in the filter.
- Block this IP… opens the Block an IP dialog with the address filled in.
- Make a rule from this URL adds a draft rule for the request's path to Blacklist rules; adjust it and click Save.
Top IPs
 View full size
The Top IPs tab adds up requests per IP over the last 5 minutes, hour or 24 hours, busiest first:
- Matching, All
- Requests that fit the method and kind filters, and all requests.
- Pages, XHR/API, Static, Downloads
- The IP's requests by kind. A real browser fetches static files along with pages; a client with only pages, or only API calls, is often a bot.
- GET, POST
- Requests by method. Many POSTs and no GETs to a login URL is a classic brute-force pattern.
- 4xx / 5xx, Rule hits
- Error responses, and requests to blacklist rule URLs.
- Blocked
- Whether the IP is blocked, how and until when, such as Firewall, in 23 h.
- Last seen, Last URL, User agent
- The IP's most recent request.
Select an IP and click Show this IP's requests to see everything it asked for, or Block this IP… to block it.
How to use it: deal with a suspicious client
- Open Top IPs, pick Last hour, and look for IPs with many 4xx errors, rule hits, or only one kind of request.
- Select one and click Show this IP's requests to see exactly which URLs it asked for, and how IIS answered.
- If it is probing for things your sites don't have, click Block this IP…, or select one of its requests and click Make a rule from this URL so the next scanner is blocked automatically.
What the request log can't see
- Requests HTTP.sys rejects before they reach IIS, such as unknown host names or malformed requests. Those are in the HTTPERR log.
- Events ETW drops under extreme load. The tab shows how many were lost.
The request log, Top IPs and rule hit counts are kept in the service's memory only, never written to disk. If the dashboard runs without the service (standalone mode), it shows requests but doesn't block.