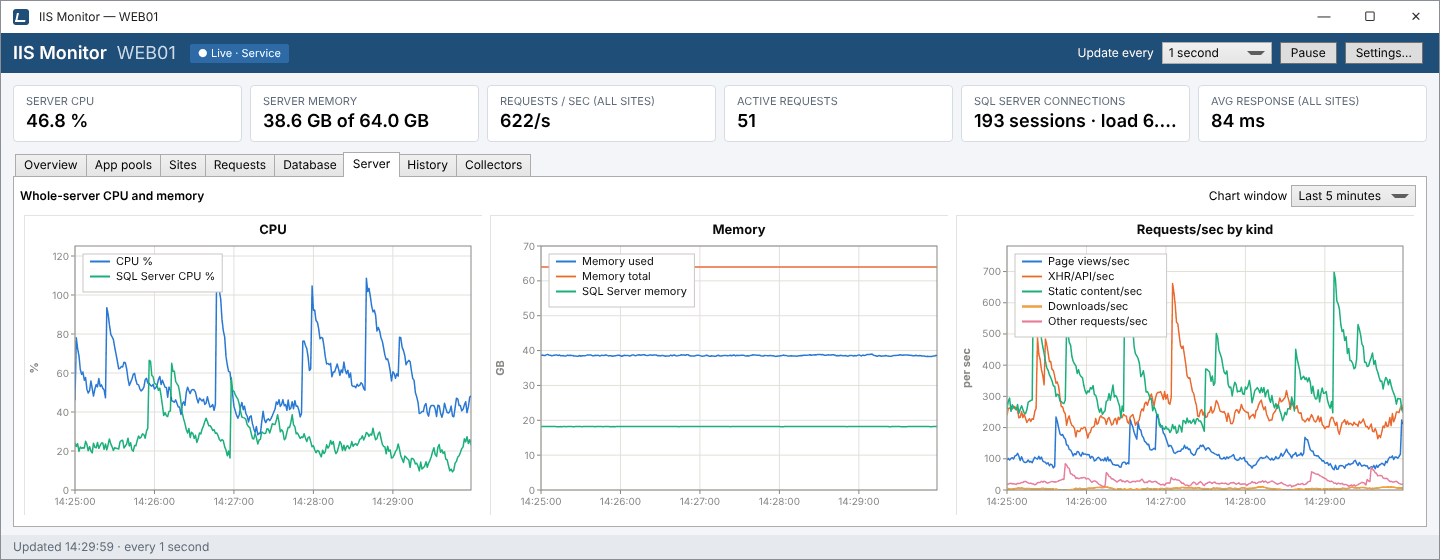
Three charts for the whole machine
- CPU
- Whole-server CPU, read from Windows' system times, with the local SQL Server process (
sqlservr.exe) as a separate line. When the server line rises and SQL Server's doesn't, the extra work is in IIS or elsewhere. - Memory
- Memory in use and total physical memory, plus SQL Server's own share. SQL Server deliberately keeps memory it has used, so a large flat SQL Server line is normal.
- Requests/sec by kind
- Page views, XHR/API calls, static content, downloads and other requests per second, across all sites, from IIS's log stream. See how kinds are decided.
Pick the time span with Chart window and hover a chart to read exact values. All three are also kept in the server's history.
Summary tiles on every tab
Six tiles at the top of the window stay visible whichever tab you are on:
- Server CPU
- CPU use of the whole machine.
- Server memory
- Memory in use of the total, such as “38.6 GB of 64.0 GB”.
- Requests / sec (all sites)
- The sum of every site's requests per second.
- Active requests
- Requests being processed right now, across all app pools.
- SQL Server connections
- Sessions reported by SQL Server, or TCP connections when no connection string is set, plus the app pools' total database load when the Database tab is set up: “193 sessions · load 6.43”.
- Avg response (all sites)
- The average response time across all sites, weighted by their requests. “not traced” means response times aren't turned on yet; “idle” means no request finished in the last interval.
The status bar and the toolbar
The status bar at the bottom shows when the screen was last updated and how often it updates, for example Updated 14:29:59 · every 1 second, and adds · 1 collector warning(s), see the Collectors tab when a data source has a problem.
The toolbar shows the server's name and a badge saying where the data comes from: the IIS Monitor service, or the dashboard itself in standalone mode. When the dashboard can't reach the service, a banner says so, with a Start the service button when the service is installed but stopped.
How to use it
- Is the whole server short of CPU? If the server CPU line sits near 100 % while no app pool on the Overview stands out, the load is spread out or outside IIS; check the SQL Server line next.
- Is it running out of memory? Compare memory in use with the total. If it is close and SQL Server holds most of it, consider capping SQL Server's max server memory.
- Did the traffic mix change? A jump in Other requests usually means a scanner; a jump in XHR/API calls often follows a front-end release.