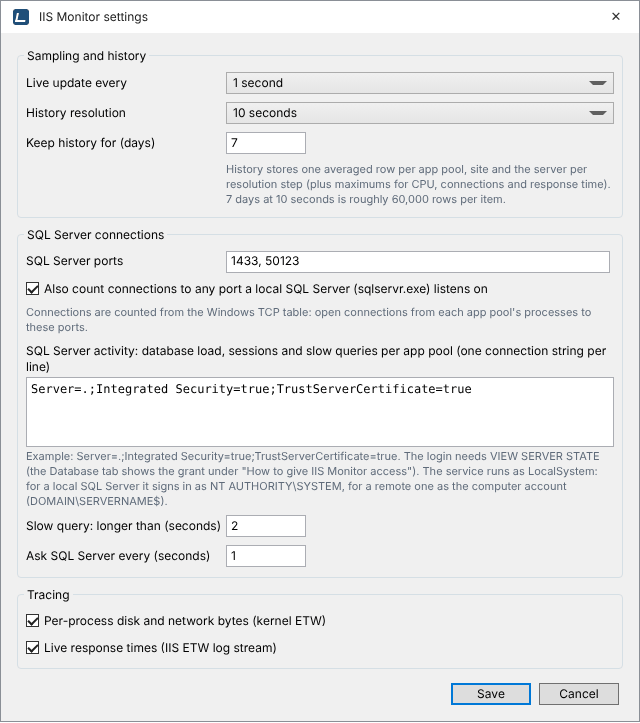
Open the settings
Click Settings… at the right of the toolbar. Settings belong to the collector service and are saved in %ProgramData%\IISMonitor\settings.json, readable only by Administrators and SYSTEM because it can hold SQL Server connection strings. In standalone mode they are saved to the same file, so they apply to the service too once it is installed.
Sampling and history
- Live update every
- How often data is collected and the screen refreshes: 0.25, 0.5, 1, 2, 5, 10 or 30 seconds, or 1 minute. One second is the default. This also sets the resolution of the live charts. The same choice is in the toolbar as Update every.
- History resolution
- How often a history row is written: 5, 10 or 30 seconds, 1 minute or 5 minutes. 10 seconds is the default; 30 seconds cuts the database to a third of the size.
- Keep history for (days)
- How long history is kept; 7 days by default. At 10-second resolution that is roughly 60,000 rows per app pool or site.
SQL Server connections
- SQL Server ports
- Comma-separated ports to count connections to, such as
1433, 50123. Connections are counted from the Windows TCP table: open connections from each app pool's processes to these ports. - Also count connections to any port a local SQL Server listens on
- Finds the ports of named instances and non-default ports on this machine automatically.
- SQL Server activity
- One connection string per line, one per SQL Server, for database load, sessions and slow queries per app pool, such as
Server=.;Integrated Security=true;TrustServerCertificate=true. The login needsVIEW SERVER STATE; see how to grant it. - Slow query: longer than (seconds)
- Queries running longer than this are recorded as slow queries. 2 seconds by default.
- Ask SQL Server every (seconds)
- 1 to 10. Each sample is one light query to SQL Server; 1 second gives the steadiest database load.
Prefer Integrated Security. The service runs as LocalSystem: it signs in to a local SQL Server as NT AUTHORITY\SYSTEM and to a remote one as the computer account (DOMAIN\SERVER$), so no password is stored anywhere.
Tracing
- Per-process disk and network bytes (kernel ETW)
- The kernel trace behind per-process disk I/O and outbound network traffic. Without it, disk falls back to process I/O counters and pool network shows website traffic only.
- Live response times (IIS ETW log stream)
- The IIS log stream behind response times, errors and the request log. Without it, those columns stay empty.
Settings found elsewhere
- Toolbar: Update every, Pause / Resume and Enable response times.
- Overview tab: which pools are on the charts, their colors and RAM shows, remembered per Windows user in
%LocalAppData%\IISMonitor\dashboard.json. - Every live tab: Chart window, from the last 2 minutes to the last hour.
- Requests tab: IIS logging per site (Set up IIS logging…), and, under Blacklist rules, the rule mode, the rules, the allow-list, trusted proxies, how often IIS changes are written (300 seconds by default) and whether to close a blocked IP's open IPv4 connections.