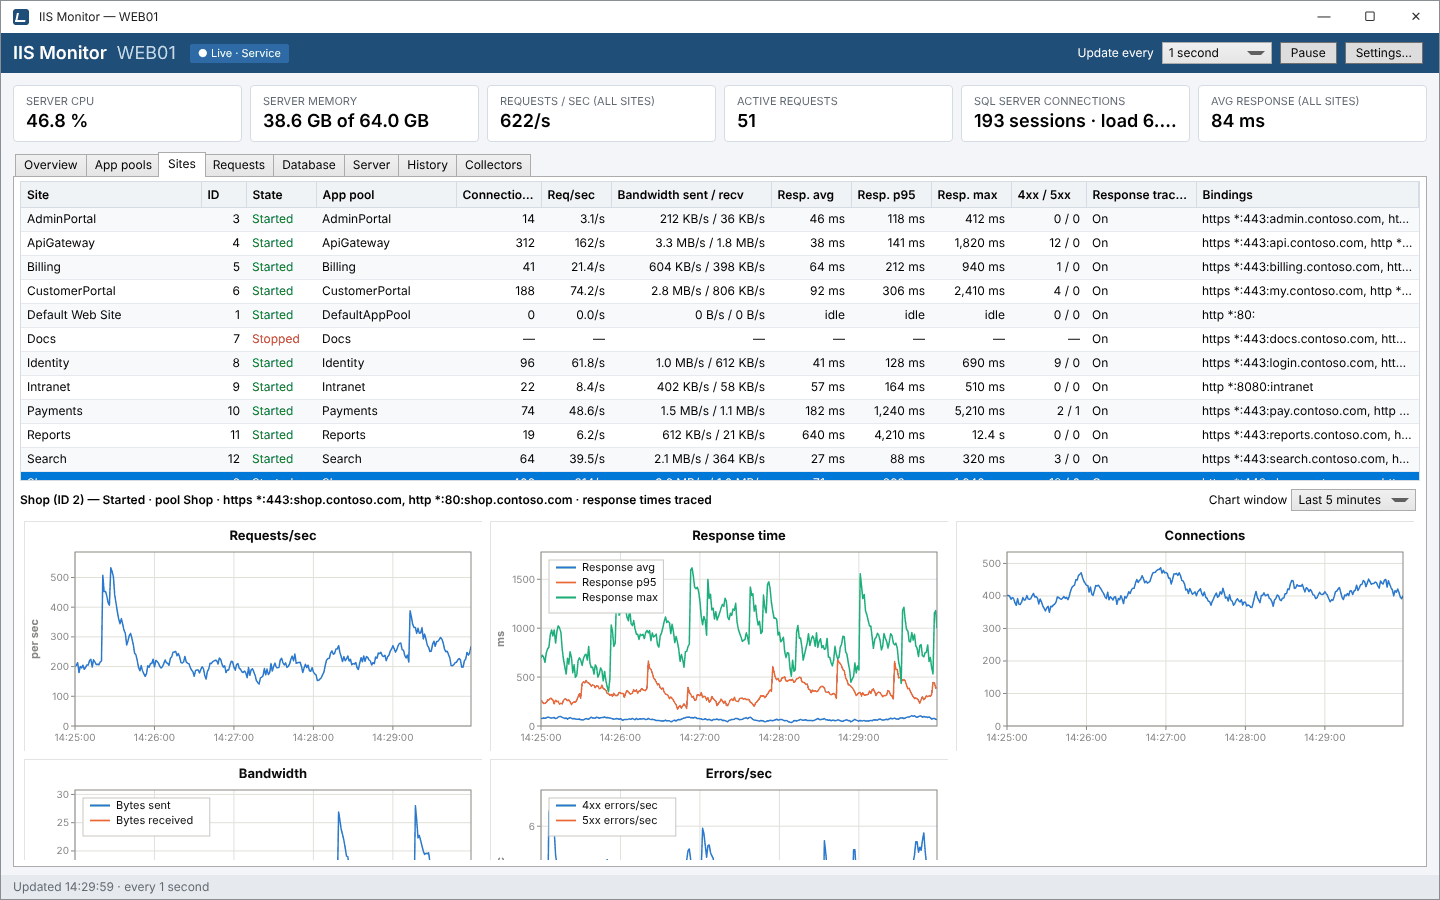
One row per website
The Sites tab lists every IIS website with its traffic and how fast it answers. Requests, bandwidth and response times are measured per site, even when several sites share an app pool.
- Site, ID, State
- The site's name and ID as in IIS Manager, and whether it is started (green) or stopped (red).
- App pool
- The pool that runs the site's root application. Its CPU and memory are on the App pools tab.
- Connections
- Current connections to the site, from IIS's
Web Servicecounters. - Req/sec
- Requests per second.
- Bandwidth sent / recv
- Bytes per second the site sends and receives over HTTP.
- Resp. avg, p95, max
- Average, 95th-percentile and longest response time of the requests that finished during the last update. IIS measures each one as
time-taken, from the first byte received to the last byte sent. - 4xx / 5xx
- Client errors (such as 404) and server errors (such as 500) during the last update.
- Response tracing
- On when the site sends its log entries to ETW, which is what live response times need.
- Bindings
- Protocol, IP, port and host name of each binding, such as
https *:443:shop.contoso.com.
“idle” in a response-time column means no request finished during that interval; a dash means response times aren't traced for that site yet.
Live charts for the selected site
Select a site to see a header with its ID, state, app pool, bindings and whether response times are traced, followed by five live charts:
- Requests/sec.
- Response time: average, p95 and maximum. The average tells you about typical visitors; p95 tells you about the slowest one in twenty; the maximum catches the outliers.
- Connections.
- Bandwidth: bytes sent and received per second.
- Errors/sec: 4xx and 5xx responses per second.
As on every live tab, Chart window picks the last 2, 5, 15 or 30 minutes or the last hour, and hovering a chart shows the exact values at that moment.
Turn on live response times
IIS Monitor doesn't read log files. Instead, IIS sends each finished request to Event Tracing for Windows (ETW), and IIS Monitor reads that stream as it happens. IIS only does this when its log target includes ETW, so the first time you open the dashboard the toolbar may show Enable response times.
- Make sure the IIS HTTP Logging role service is installed. In PowerShell:
Install-WindowsFeature Web-Http-Logging. - Click Enable response times in the toolbar. IIS Monitor explains what it will change and asks before doing it.
- It sets the W3C log target to
File, ETW, so log files are still written exactly as before, and switches on the log fieldss-sitename,cs-uri-stem,sc-statusandtime-takenif they are off. The change is made inapplicationHost.config, for the site defaults and for any site that overrides them. - Within a few seconds, the Response tracing column shows On and the response-time columns fill in. The button disappears once every site is traced.
Sites that use IIS's central binary logging can't be traced this way. The Collectors tab shows how many sites are traced and how many requests have been seen.
How to use it: investigate a slow site
- Sort the grid by Resp. p95 to find the site whose slowest requests are slowest.
- Select it and look at the Response time chart: a gap between average and p95 means some requests are much slower than the rest, often a particular page or a query.
- Check the Errors/sec chart. A rise in 5xx errors at the same time often explains it.
- Open the Requests tab, choose the site and sort by Time taken to see exactly which URLs are slow and who requested them.
- If the site's pool is busy in SQL Server, the Database tab shows which queries.