Two levels of SQL Server insight
Connections, with no setup
Out of the box, IIS Monitor counts the open TCP connections from each app pool's processes to SQL Server: port 1433, any port a local SQL Server listens on, and ports you add. You see them in the DB conns column and charts.
Load, blocking and slow queries
Add a connection string and the Database tab lights up: what each app pool is running in SQL Server right now, what it is waiting for, who is blocking whom, and which queries are slow.
Give IIS Monitor access to SQL Server
Nothing is installed on SQL Server and no trace is started. IIS Monitor reads SQL Server's dynamic management views, which needs one permission.
- Open Settings and, in the SQL Server activity box under SQL Server connections, add one connection string per SQL Server, for example:
Server=.;Integrated Security=true;TrustServerCertificate=true - Let that login see server activity. The IIS Monitor service runs as LocalSystem, so for a SQL Server on the same machine, run this once in SQL Server Management Studio:
USE master; IF SUSER_ID(N'NT AUTHORITY\SYSTEM') IS NULL CREATE LOGIN [NT AUTHORITY\SYSTEM] FROM WINDOWS; GRANT VIEW SERVER STATE TO [NT AUTHORITY\SYSTEM]; - For a SQL Server on another machine, grant the same permission to the IIS server's computer account,
DOMAIN\SERVER$. On SQL Server 2022 and later,VIEW SERVER PERFORMANCE STATEis enough.
Until a connection string is set, the Database tab shows these steps. Later they stay available under How to give IIS Monitor access to SQL Server at the bottom of the tab, and a warning appears there if SQL Server can't be reached or the permission is missing. In standalone mode the dashboard connects as your own Windows account, which then needs the same permission.
How queries are matched to app pools
Every second (set Ask SQL Server every from 1 to 10 seconds), the service asks SQL Server which requests are running, through sys.dm_exec_requests, and which client process sent each one (host_process_id). It maps that process ID to the app pool it belongs to, exactly as it does for CPU and memory.
A query counts as coming from this server when the client reports this computer's name as its host name, which is the default. Connection strings that set Workstation ID show up as “other servers”.
Database load per app pool
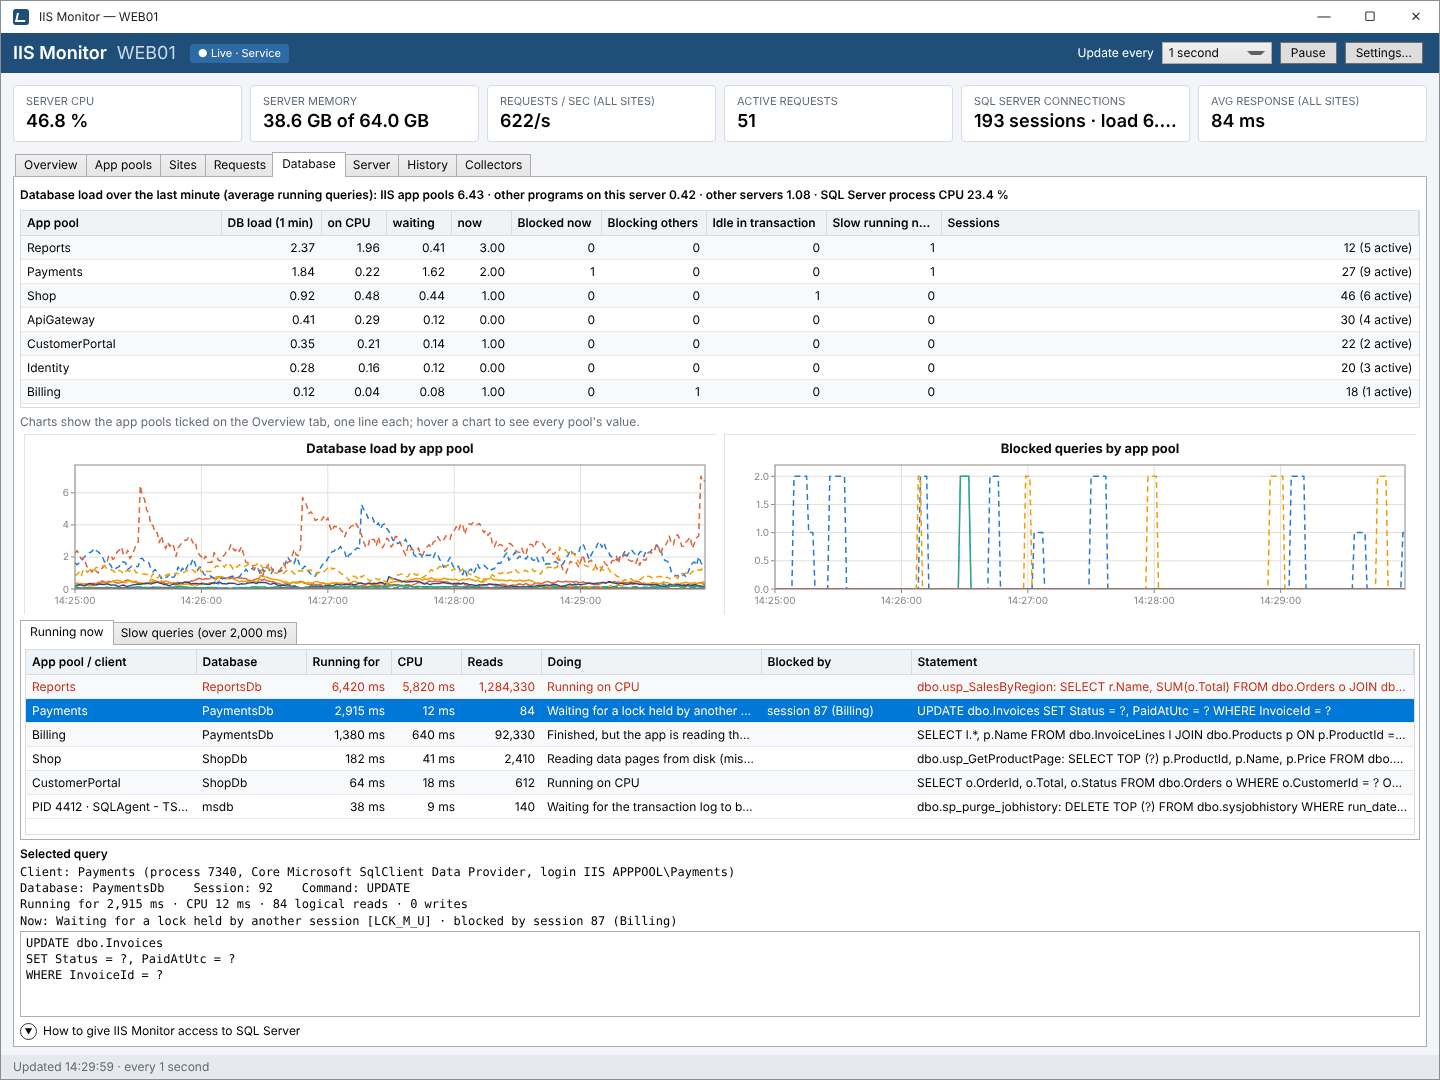
The line at the top sums it up, for example: Database load over the last minute (average running queries): IIS app pools 6.43 · other programs on this server 0.42 · other servers 1.08 · SQL Server process CPU 23.4 %. The grid below breaks it down by pool, ranked by the last minute:
- DB load (1 min)
- The average number of the pool's queries running at once over the last minute. 1.00 means one query busy all the time; 3.00 means three. Sampling every second makes this accurate over a minute even for queries that take a few milliseconds.
- on CPU, waiting
- The same load, split into time spent on CPU and time spent waiting: for locks, disk, memory, the network or the app.
- now
- Queries running at the latest sample.
- Blocked now
- The pool's queries waiting for another session's locks.
- Blocking others
- Other sessions waiting for this pool's locks.
- Idle in transaction
- Sessions holding a transaction open while doing nothing, a common cause of blocking.
- Slow running now
- Queries already past the slow threshold and still running.
- Sessions
- The pool's sessions, and how many are active.
Why sample instead of using SQL Server's totals? SQL Server's own per-session counters only update when a query finishes, and reset every time a pooled connection is reused, which in a web app is constantly. Sampling what is running every second gives a steady, comparable number for every pool.
Two charts show database load by app pool and blocked queries by app pool, one line per pool ticked on the Overview tab. The App pools grid also has a DB load column, and each pool's history keeps database load, blocking and slow-query counts.
Running now
Every query from this server that is running at that moment, longest first. Queries already over the slow threshold are red.
- App pool / client
- The app pool, or the process ID and program name for anything else on the server, such as SQL Server Agent.
- Database, Running for, CPU, Reads
- Where it runs, for how long so far, CPU time used and logical reads.
- Doing
- What it is doing, in plain words rather than wait-type names.
- Blocked by
- The session holding the lock it waits for, with that session's app pool, such as session 87 (Billing).
- Statement
- The procedure and statement, with literal values replaced by
?.
Some of the descriptions in the Doing column, and what they usually mean:
| Doing | Wait type |
|---|---|
| Running on CPU | — |
| Waiting for a lock held by another session | LCK_* |
| Finished, but the app is reading the results slowly (too many rows, or row-by-row processing) | ASYNC_NETWORK_IO |
| Reading data pages from disk (missing index or too little memory) | PAGEIOLATCH_* |
| Waiting for the transaction log to be written | WRITELOG |
| Waiting for memory to run the query (large sort or hash) | RESOURCE_SEMAPHORE |
| Long CPU work, sharing the CPU with other queries | SOS_SCHEDULER_YIELD |
| Parallel query waiting for its slowest thread | CXPACKET, CXCONSUMER |
| Contention on hot in-memory pages (often tempdb or inserts at the end of a table) | PAGELATCH_* |
| Waiting for a linked server or remote call | OLEDB |
| Waiting for an availability-group replica to confirm the commit | HADR_SYNC_COMMIT |
Slow queries
 View full size
Every query that runs longer than the threshold (2 seconds by default, set in Settings) is recorded when it finishes, with its app pool, database, duration, CPU, reads, main wait (or CPU), the app pool that blocked it if any, and its statement. Slow queries are kept with the rest of the history.
- Named after what the app sent. Each slow query is named after the stored procedure the app called, or the batch or parameterized query it sent, even when the time went into a nested procedure, function or trigger. Runs that differ only in literal values group together.
- Costliest first. The list groups runs and sorts them by total time, with the number of runs, average, longest, total, CPU, reads and what they were mostly doing.
- Where the time went. Select a row to see the full statement and the module where the longest run spent most of its time, and whether, and by which app pool, it was blocked.
- Filter it. Show the last 15 minutes, hour, 24 hours or 7 days, for all pools or one.
Accurate, even for queries just over the threshold
Queries are watched from one sample interval before the threshold, and sampled once more right when they reach it. When a query ends between two samples, its exact duration is taken from SQL Server's record of the session's last request, so queries just over the threshold aren't missed.
Waits that are ignored on purpose
Some queries wait by design: Service Broker and SqlDependency listeners, WAITFOR and trace readers. They would otherwise look like endless slow queries, so they are left out.
No customer data in your history
Statements are stored and shown with literal values replaced by ?, double-quoted values included, so WHERE Email = 'x@y.com' becomes WHERE Email = ?. Customer data never gets copied into the history database.
How to use it: find what is slowing SQL Server down
- Look at the pools grid: the pool at the top has the highest database load over the last minute.
- Compare on CPU with waiting. Mostly CPU points to heavy queries; mostly waiting points to locks, disk or the app reading results slowly.
- If Blocked now or Blocking others is above zero, open Running now: the Blocked by column names the session and app pool holding the lock. Idle in transaction sessions are a frequent culprit.
- Open Slow queries for the last hour or day. The procedure at the top costs the most time in total; select it to see the statement inside it that took longest.
- Use the History tab to check whether that pool's database load changed after a deployment.